FY24/25 Q1 Australian eCommerce Benchmarking Data
21 October 2024 Blog Posts
In the current eCommerce environment, understanding how your business stacks up next to your industry peers is key to driving growth, staying competitive, and maintaining your sanity.
This data looks specifically at Quarter 1 of the current financial year, July 2024 to September 2024.
How to Use Megantic’s eCommerce Benchmarking Data
Megantic has reviewed internal data of 100+ clients in select industries and focused on three main metrics—each offering a snapshot of your performance compared to your competitors.
Click-Through Rate (CTR): The number of users who have seen the organic listing in Google Search results (SERPs) and clicked to view the page, divided by the total number of users who saw the listing. This was collected from Google Search Console (GSC).
Cart-to-View Rate: The number of users who added a product to their cart, divided by the total number of users who viewed the product. This was collected from Google Analytics 4 (GA4).
Conversion Rate (CR): The number of users who purchased a product, divided by the total number of users who visited the website. This was collected from Google Analytics 4 (GA4).
These benchmarks may help you pinpoint strengths of your organic search strategy and areas for improvement, allowing you to make smarter, data-driven decisions to increase your conversions.
Average data across all verticals
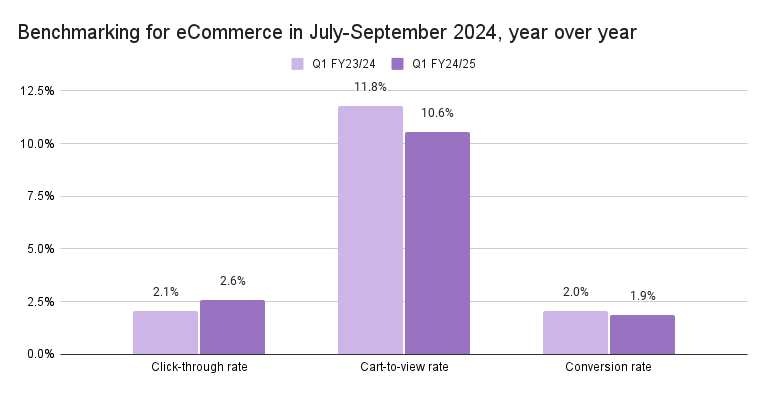
Looking at the overall average for FY24/25 (vs FY23/24), there are positive signs:
- Average click-through rate has jumped to 2.6% from 2.1%, meaning more people are clicking on Google search listings.
- The cart-to-view rate has slightly dipped from 11.8% to 10.6%, indicating that while people are landing on product pages, there’s a small drop in the number who are adding items to their cart.
- The conversion rate is holding steady at 1.9%, down slightly from 2.0% which is in line with NAB’s monthly data insights, stating that transactions decreased 0.3% in September.
Monthly Trends
The monthly data is pretty steady, with July leading the charge in click-through rates at 2.64%. Although August and September are slightly lower at around 2.53%-2.54%, this consistency is great for maintaining traffic throughout the quarter. Meanwhile, the cart-to-view rate saw a nice jump in September, hitting 10.78%, which could be a sign of increased interest as shoppers prep for Black Friday/Cyber Monday and the end-of-year season.
Vehicles and Parts
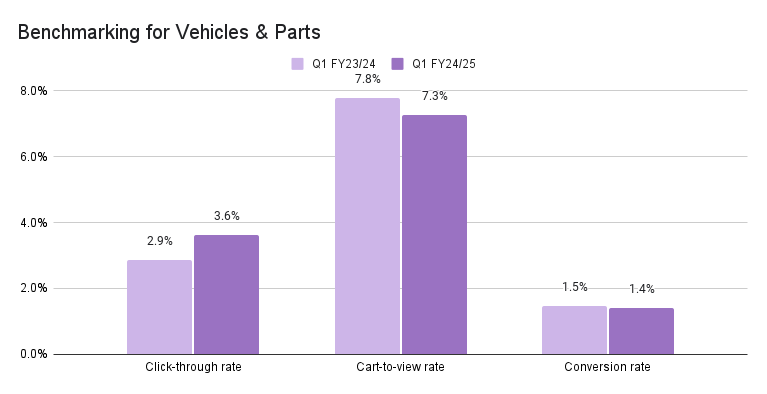
The vehicles & parts niche is a standout performer, with click-through rates from Google significantly above the eCommerce average. This is a statistic we see often with our automotive clients. Shoppers who are wanting to purchase automotive gear are often very specific about what they want to buy. They will search by product and include specific information like car make, model and year.
The beginning of the quarter in July held the best results for this industry with a slight decrease during September. Compared to the eCommerce average, click-through rates were higher at 3.6% compared to 2.6%.
Some of our clients in this industry include Car Builders, Exhaust Shop and OCAM Industries.
Apparel and Accessories
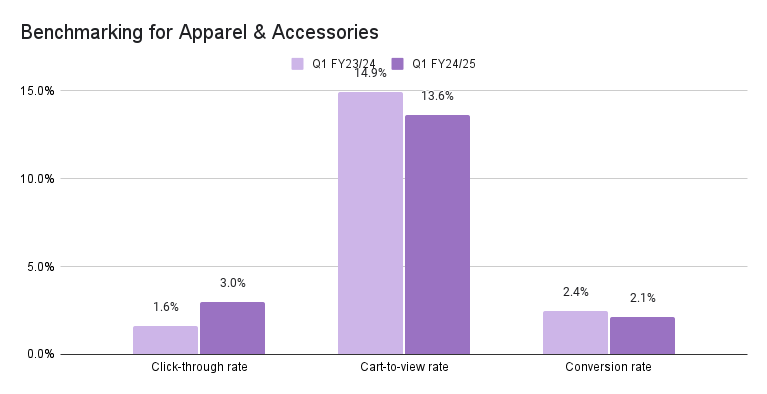
The apparel and accessories sector is showing impressive growth this year, with the average click-through rate jumping from 1.6% in FY23/24 to 3.0% in FY24/25. This significant increase, almost double, suggests that these brands are seeing more visibility in search results, bringing more potential customers to their sites.
Our apparel and accessories clients saw cart-to-view rates as high as 13.89% in Q1, compared to an average for all industries of 10.6%. In simple terms, about one in ten shoppers who check out a product are adding it to their cart. When we consider that shoppers are likely to be looking at similar products, this is a strong sign that the product pages and product descriptions are doing a great job at meeting their needs.
Some of the clients in this category include Aquila, Hello Molly and Cargo Crew.
Arts and Entertainment
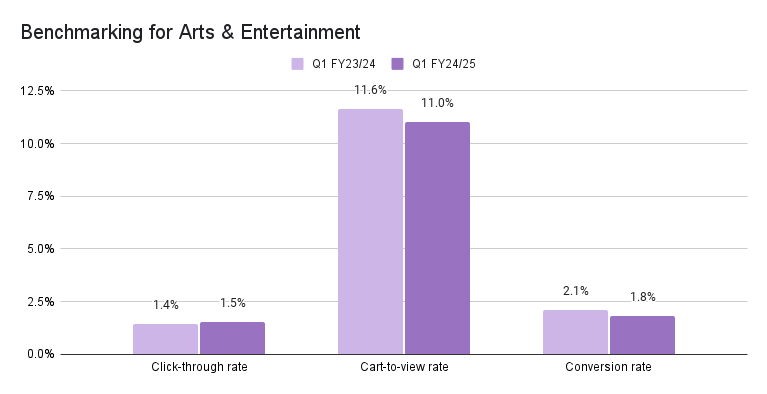
Arts and entertainment brands have maintained a strong click-through rate throughout Q1 in FY24/25, holding steady at around 1.5%. This consistency signals that our clients are maintaining a secure presence in search results, and their target audience is continuing to find and engage with their products. Comparing the Q1 last financial year, we have seen an increase of click-through rates from 1.4% to 1.5%.
Cart-to-view rates remain strong and are above the the eCommerce average. This Q1 saw 11% of adding products to their cart after viewing. For eCommerce as a total, this was at 10.6%.
Additionally, conversion rates were held consistently around 1.8% through the months of July to September, showing that the strategies driving purchases are working well even during monthly fluctuations.
For all statistics, July was the strongest month out of the quarter for arts and entertainment, but only by a maximum of 0.3%.
Some of our clients in this industry include Monte Mart, Scrapdragon and Riffs and Licks.
Business and Industrial
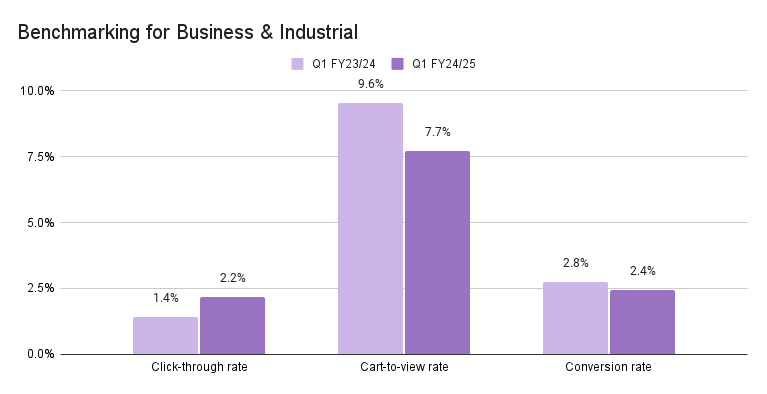
Business & industrial clients at Megantic enjoyed a strong surge in click-through rates, increasing from 1.4% to 2.2% year-over-year this quarter. This signifies that our clients metadata, including title tags and meta descriptions, are written correctly and converting clients. If you’re seeing similar gains, now’s the time to build on that momentum and focus on converting those visitors into loyal customers.
Looking specifically by month, July was the strongest month this quarter. Many of the customers for these clients are small businesses, and their new budgets refresh every July. This is why it is important to look at why trends may be occurring. It can be a great way to prepare for the next year and to maximise profits. For example, holding a large sale during this time may not be a great idea, as sales are would be made anyway. Conversely, it may also be a good idea, as competitors may be offering sales and undercutting prices.
Some of the clients in this category include Ink Station, Capital Equipment, and Admerch.
Home and Garden
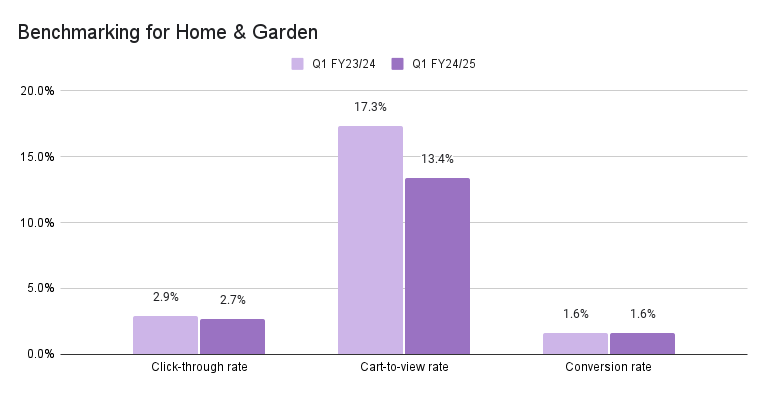
Looking at the home and garden niche, the click-through rate, cart-to-view rate and conversion rates are all on par with eCommerce averages. Click-through rates average at 2.7%, zigzagging from 2.8% in July to 2.3% in August and a high of 3% in September. Cart-to-view rates were similar, moving from 12.4% to 12.1% and ending at 15.5%. Conversely, conversion rates remained steady each month, with an average of 1.6% and minimal deviation. For garden-related clients, we know that the hobby is seasonal, so we expect increases between July- September, especially in Victoria & New South Wales.
Some of our clients in this niche are Outdoors Domain, Milkcan and Matchbox.
Sporting Goods
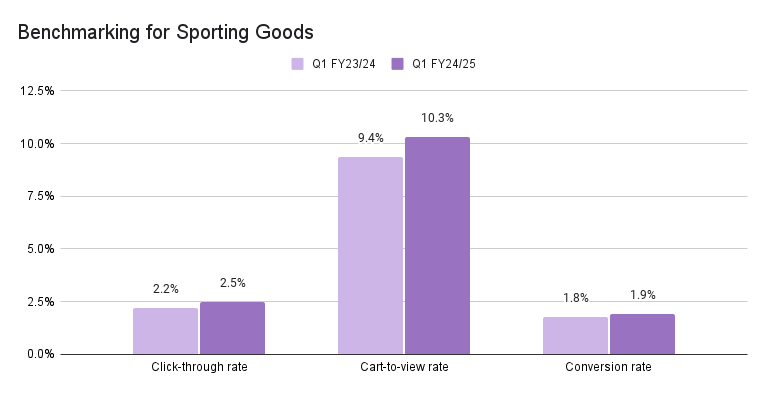
The sporting goods industry is seeing encouraging growth across the board. Click-through rates improved from 2.2% to 2.5% year over year, signalling that products are becoming more visible to potential customers and search listings are enticing. Not only are more people finding products in search results, but the slight rise in engagement metrics, such as cart-to-view rates, shows that these visitors are taking action by considering products and later purchasing. The consistent improvement across key metrics indicates a solid SEO foundation that’s continuing to drive quality traffic.
Click-through rates have grown steadily throughout July to September to a high of 2.58%. Cart-to-view rates and conversion rates were stable and saw a strong high in August.
Some of the clients in this category include Basketball Jersey World, House of Golf and MMA Factory.
In Summary
As you can see, the eCommerce landscape can look very different depending on the vertical, with each niche having its own customer behaviours.
By sharing this quarter’s averages for CTR, CTV, and CVR rates, we hope we can give the Australian eComm community a little insight into how they’re faring and where they can best focus their energy to drive more sales in the tough economic climate we’re in.
Use this data as a benchmark to set realistic goals and make informed decisions that drive growth. Whether it’s refining your product offering, enhancing user experience, or adjusting your marketing strategy, leveraging these benchmarks will help you to stay ahead of the curve.


